Conveymap
Convey map is the user interface for all geospatial data within the CLS ecosystem. It operates much like Google or Bing maps, in that you can search and explore an area. Where it differs from most web mapping applications is that it allows you to layer license data and view it on top of contemporary or historic mapping.
Policies Available
How to
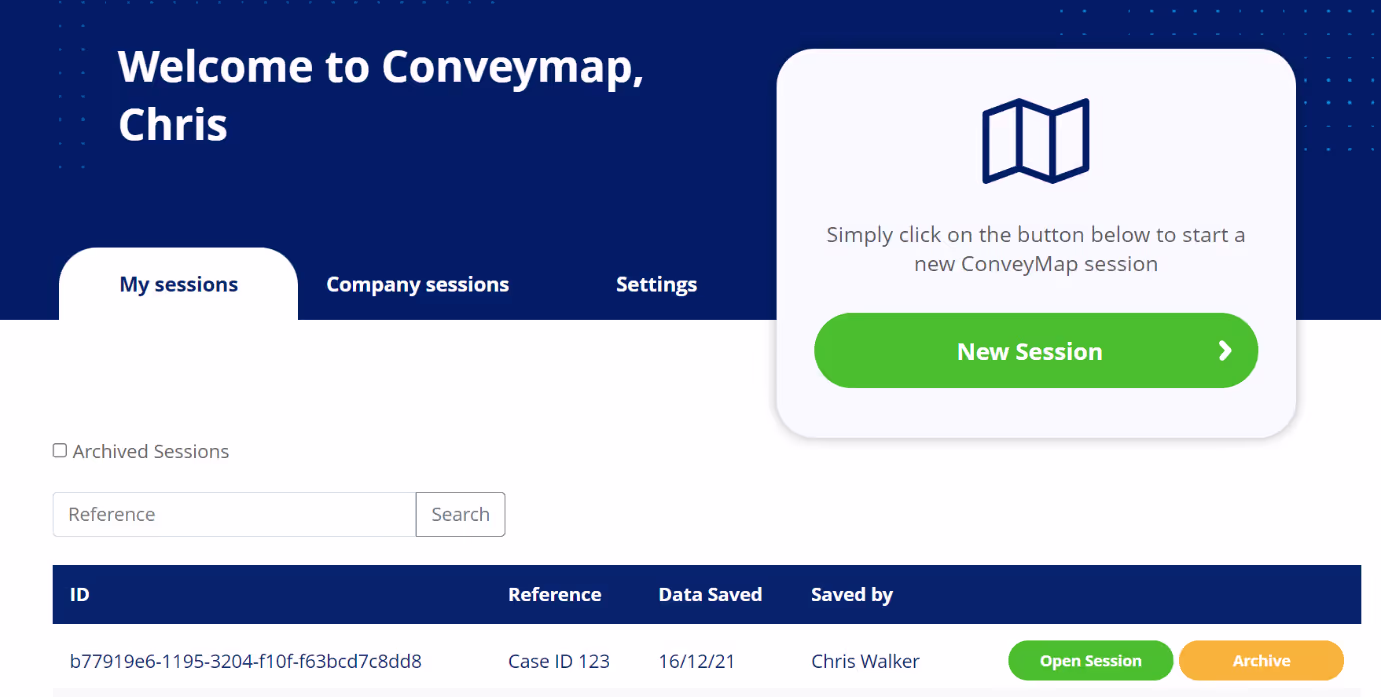
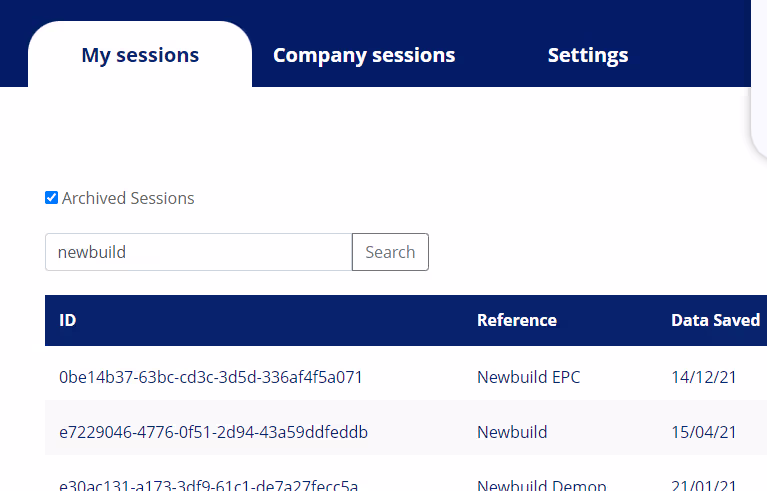
The application splash screen allows you to revisit saved cases or start a new one. Sessions are saved into a searchable list in the lower portion of the screen.
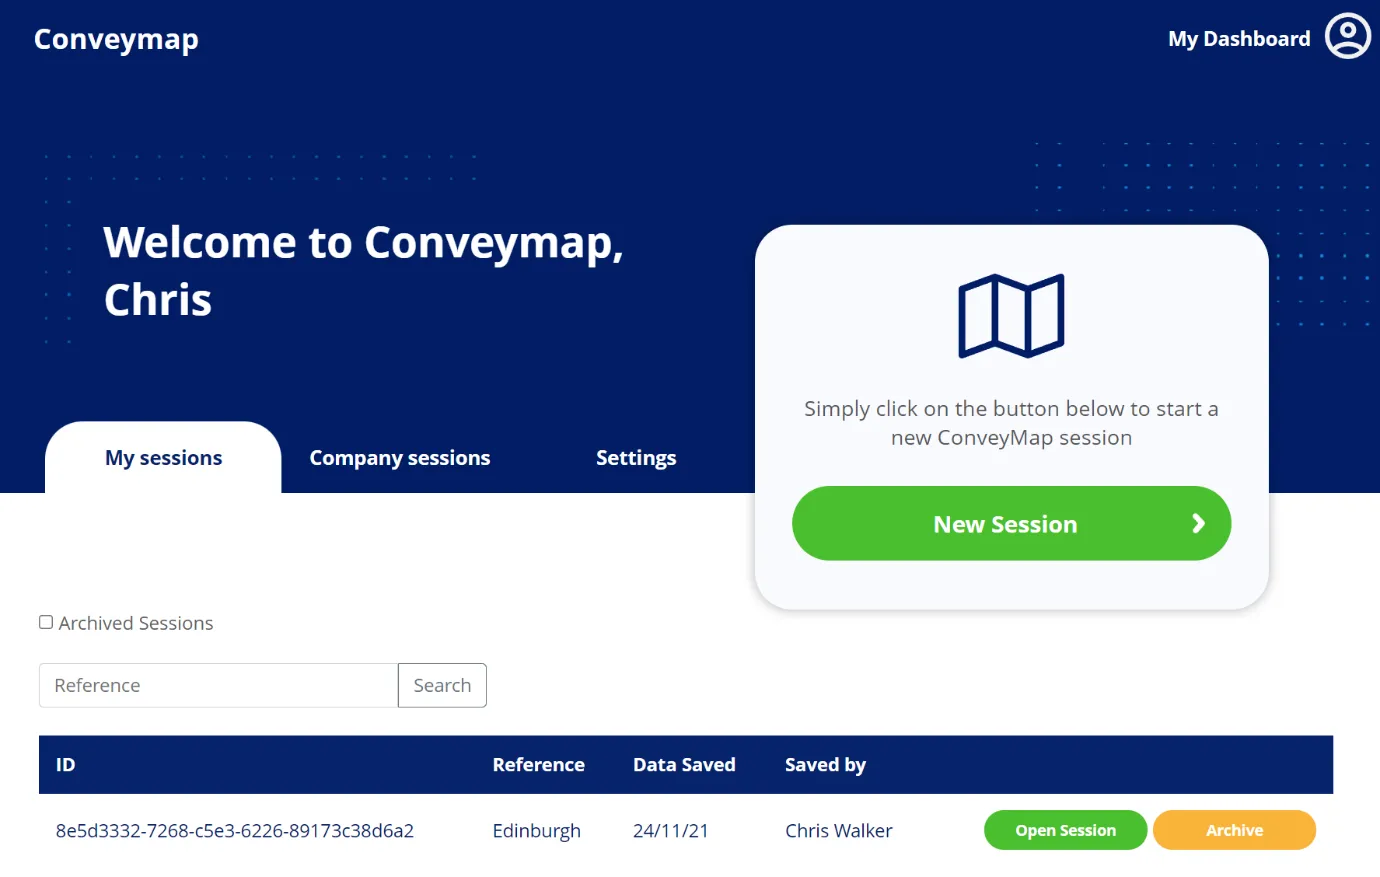
This splash screen also allows you to archive old cases and if enabled view cases that others within your company are working on. Allowing for the swift sharing of data between coworkers. Please contacts CLS to have this function enabled.
Getting started
Upon creating a session, the user will be landed on the web mapping interface. On this screen you can access any of the tools that drive the user experience.
These are broken down into three main zones. These zones float on top of the map background.

The top bar is the tool bar highlighted in red, this tool bar has the constant: My Dashboard button allowing the user to leave the application into another. Also, it includes the tools for driving the mapping interface. Here you can use the locator to find a site or place of interest, Save the session or generate annotations and print them.
The Bottom right section highlighted in green includes the mapping layers, clicking the layers button will extend the drawer of layers that you have licensed. It also gives
The filters tab in blue to the right, has the ability to interact with any of the layers you have enabled/. IN here you can apply filters or inspect results of a query against data where the mouse was clicked.
To navigate to a site, using the Locator button in the top tool bar, it will present you with the following menu
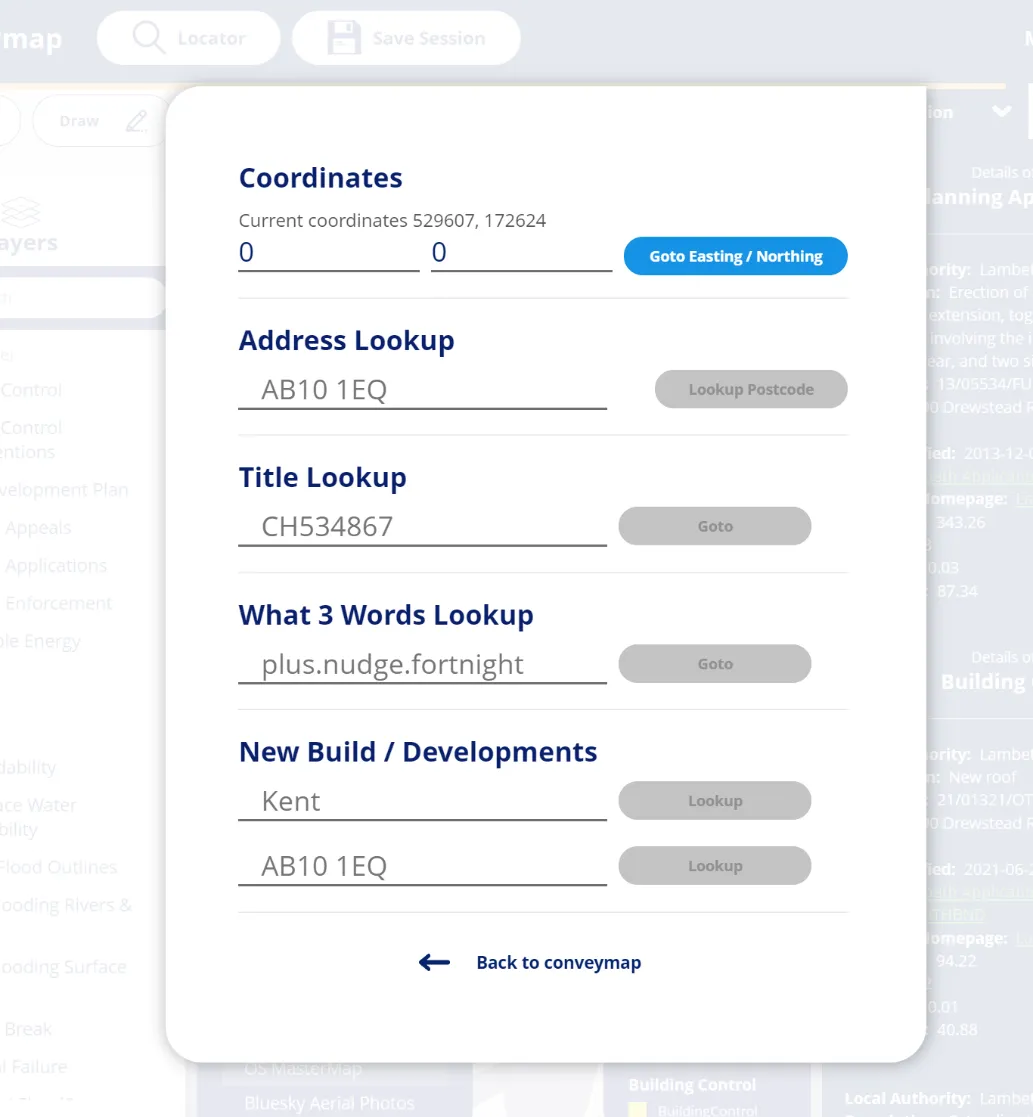
Within this locator tool you can search using various methods.
- Coordinates allows for navigation by the British national grid, insert X Y points and it will take you to the point on the moa.
- Most commonly the Address Lookup, is driven by postcode. This will then return a list of addresses available within that postcode.
- Title search will within England and Wales locate the title extents for any given title number.
- What 3 Words allows the user to locate any 3x3meter grid within the British grid.
- Newbuild finder leverages the tracking newbuild developments and allows for fuzzy postcode lookup against a developer. Entering a partial postal sector will show what developers are operating within that area and what their developments are called.
Depending on account licensing, it may be that you have limited panning within a 1km radius when you locate the address of interest. These restrictions can be altered by a member of the CLS Team.
Querying
Once you have located a site, you can open the layers tab on the left and enable some layers to interrogate.
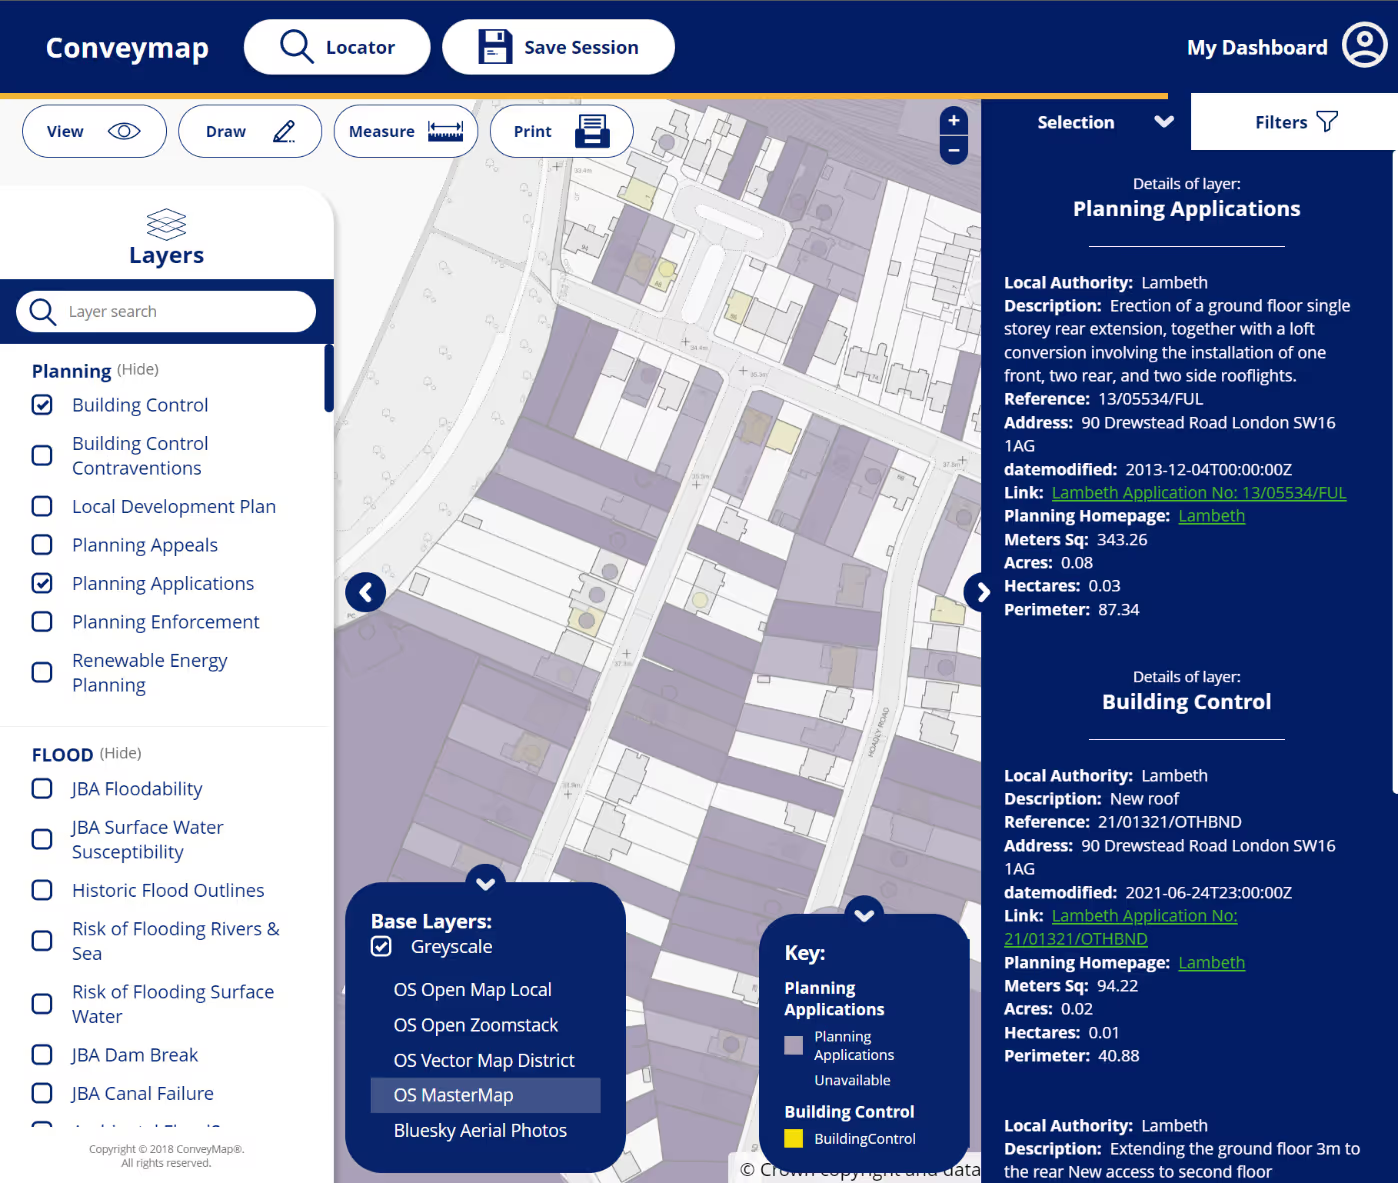
Here the user has enabled Building control and Planning applications. Each of these are shown on the map, as separate layers. The key tab will show what colors denote what. In this case, purple shows planning and yellow building control.
The number of layers that are available to the user is dependent on the licensing agreement they have entered into. Some premium datasets carry a third-party royalty.
When multiple layers are licensed, the list on the left can become long, the ‘Layer Search’ at the top allows the user to search for a layer by name.
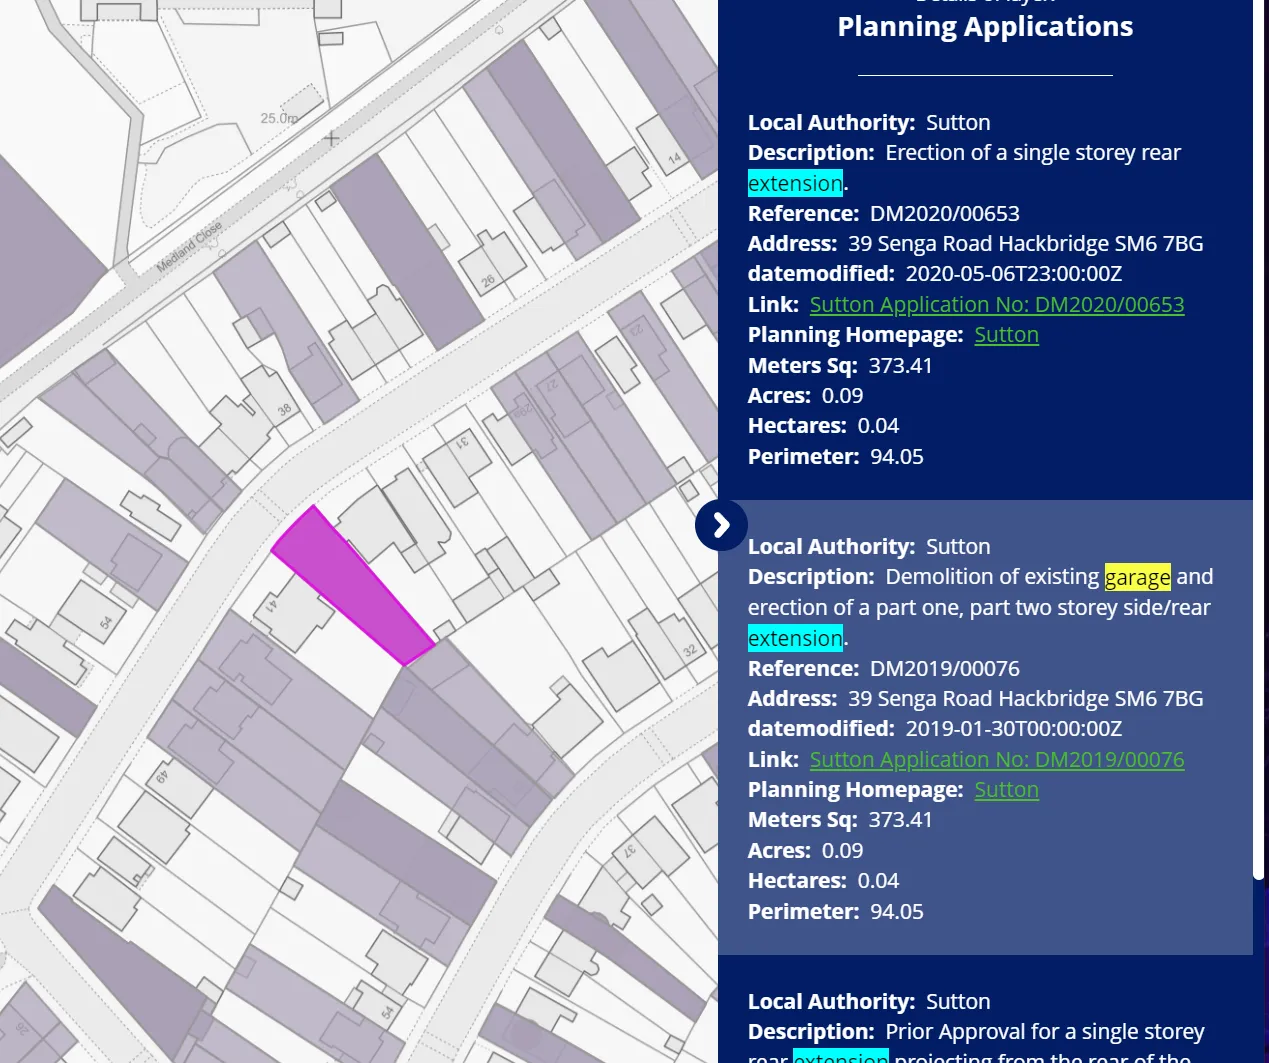
In the above example the base map has been set to OS MasterMap and the greyscale toggle has been selected to ensure maximum visibility. Information on the left bar is displayed as the user has clicked on a property to query what is available for the two selected layers. The data is then displayed on the right of the screen.
Wherever possible hyperlinks are included to allow the user to view back to the source of the data. At times these external sites may be offline. Unfortunately this is out of CLS control.
Clicking on the data on the results tab on the left will highlight the extents to which the information pertains. The selected shape is highlighted in bright pink. Data returned on the right is split between the enabled layers
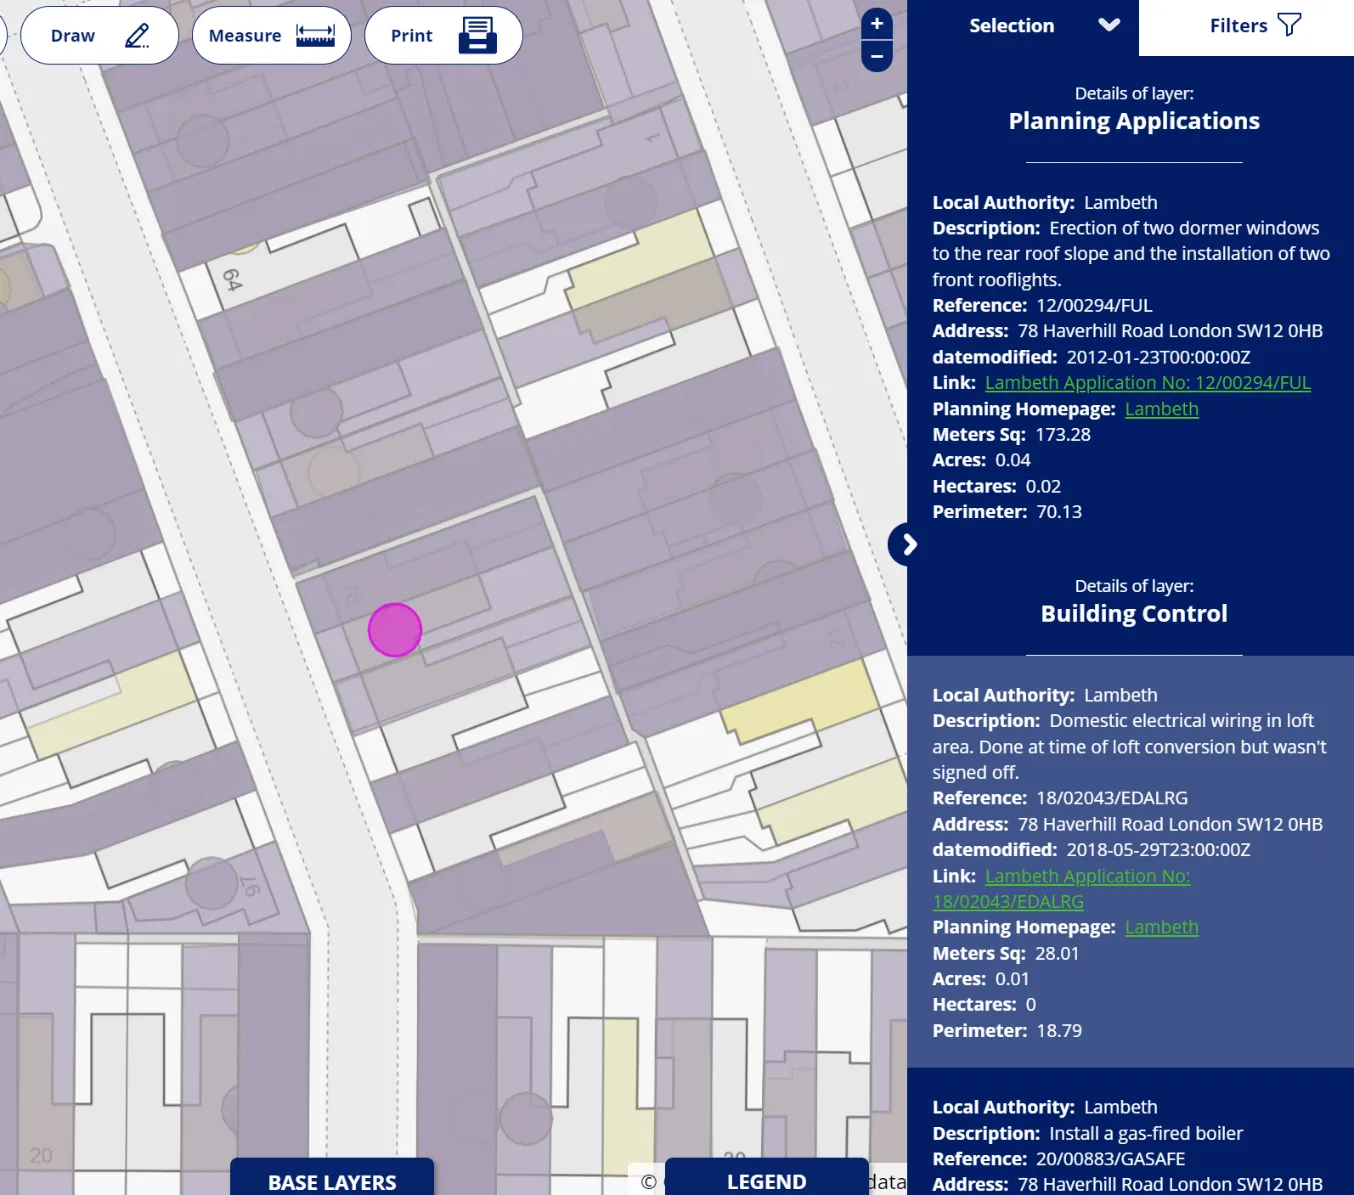
This however is showing all the data – with no filters enabled. Which in some areas can become overwhelming and difficult to determine what is relevant to the user.
Filtering
There are 3 main types of filtering that allow the user to view and select data based on their requirements.
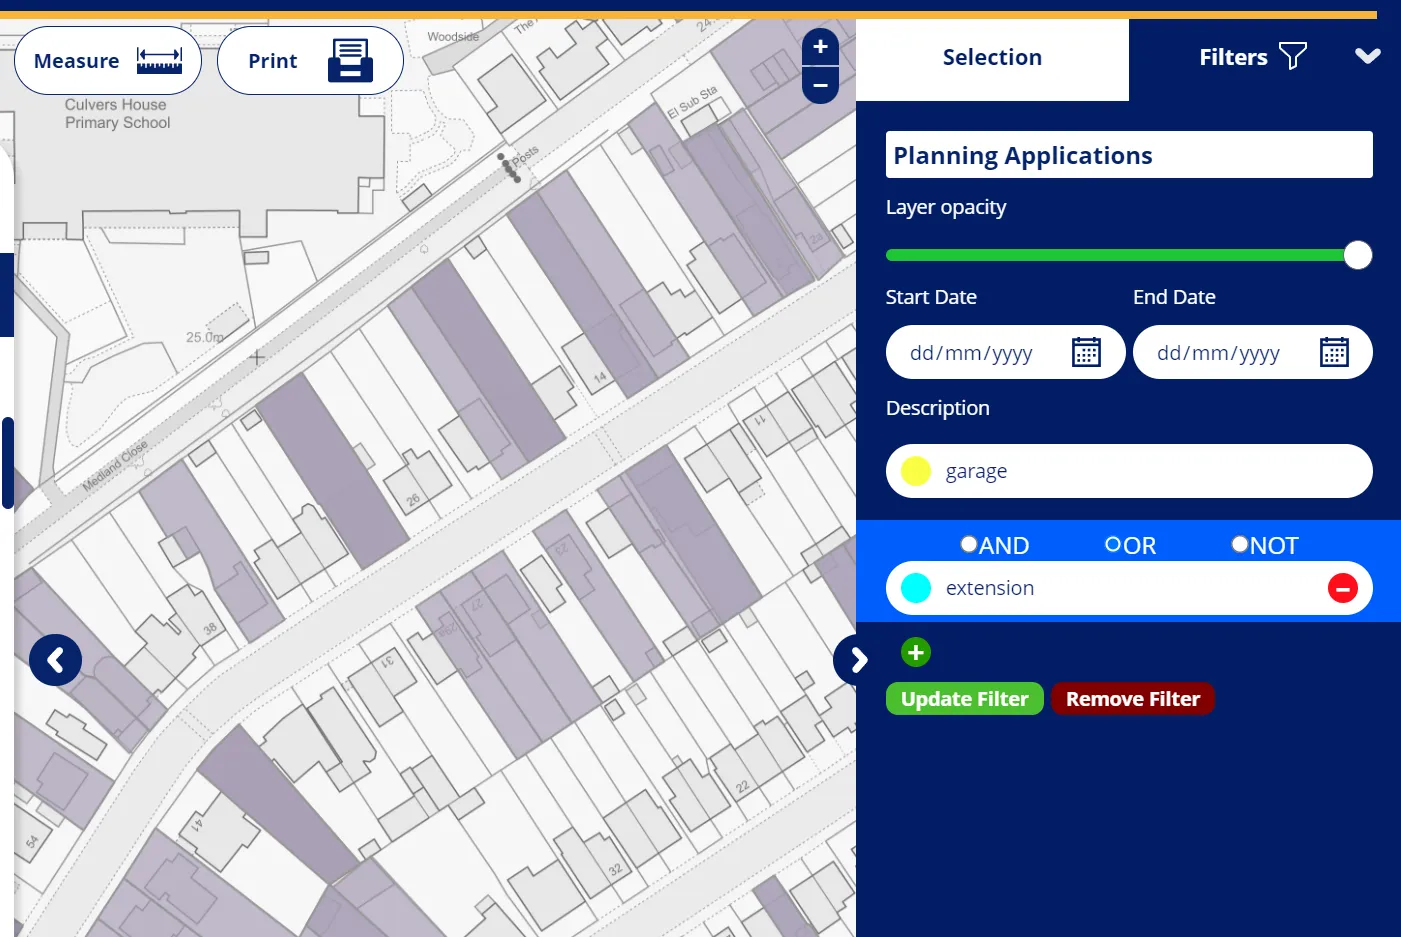
Keyword
Here you can type anything you want to filter against a free text field within the dataset. This function also allows you to set up And, Or Not statements. When the data is returned the keywords are color coded dependent on the circle to the left of the text entry box, and highlighted. Within the text field response.
Time
For datasets that have a temporal aspect its possible to refine the results displayed on the map by a time period. This is done with a basic To – From date selector.
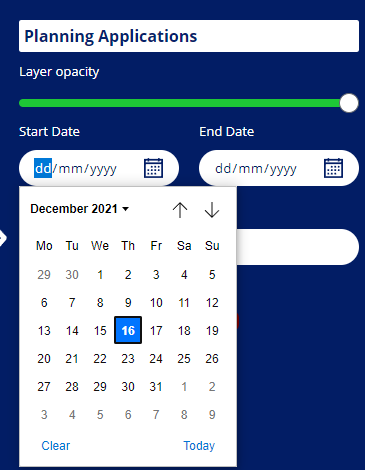
Some datasets may include live data leaving the end date open allows for any future dates to be returned
Dropdown
Where the data has keyed values we have set classed them into distinct drop downs, this is particularly useful for looking at flood data return periods or tenure of titles.

Viewing
With multiple datasets enabled on page its possible that certain layers need to be displayed on top of one another. The layers are all adjustable in the right bar, using the transparency sliders. You can also drag and drop the layer header bar to adjust their layer ordering.
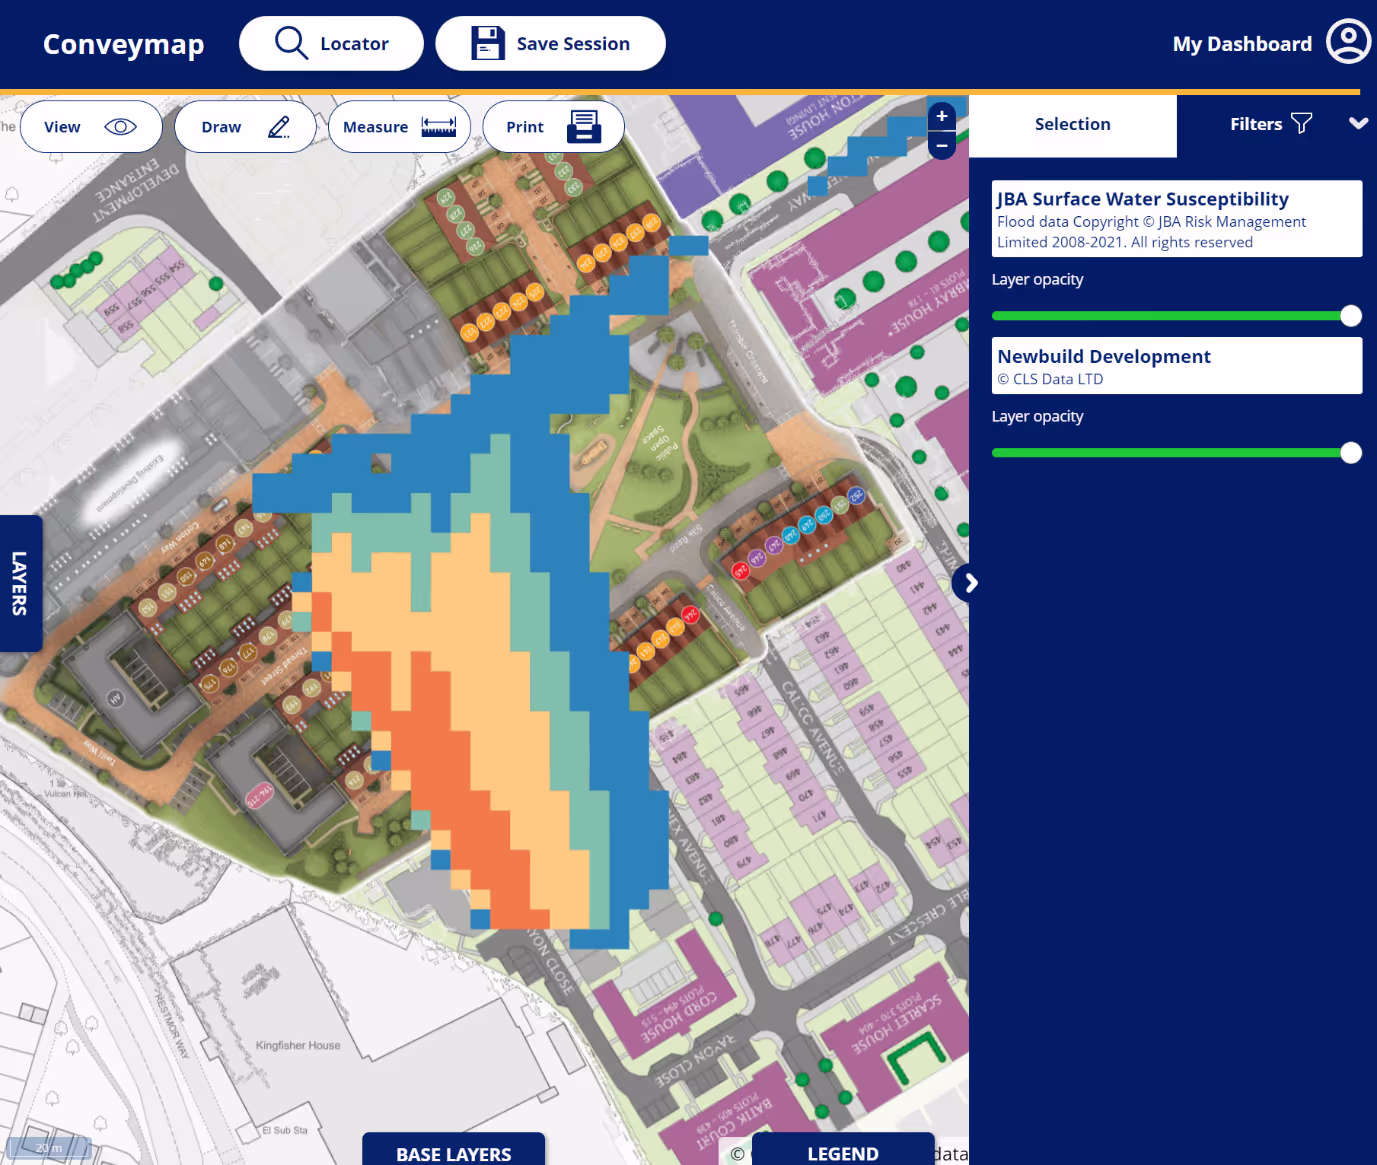
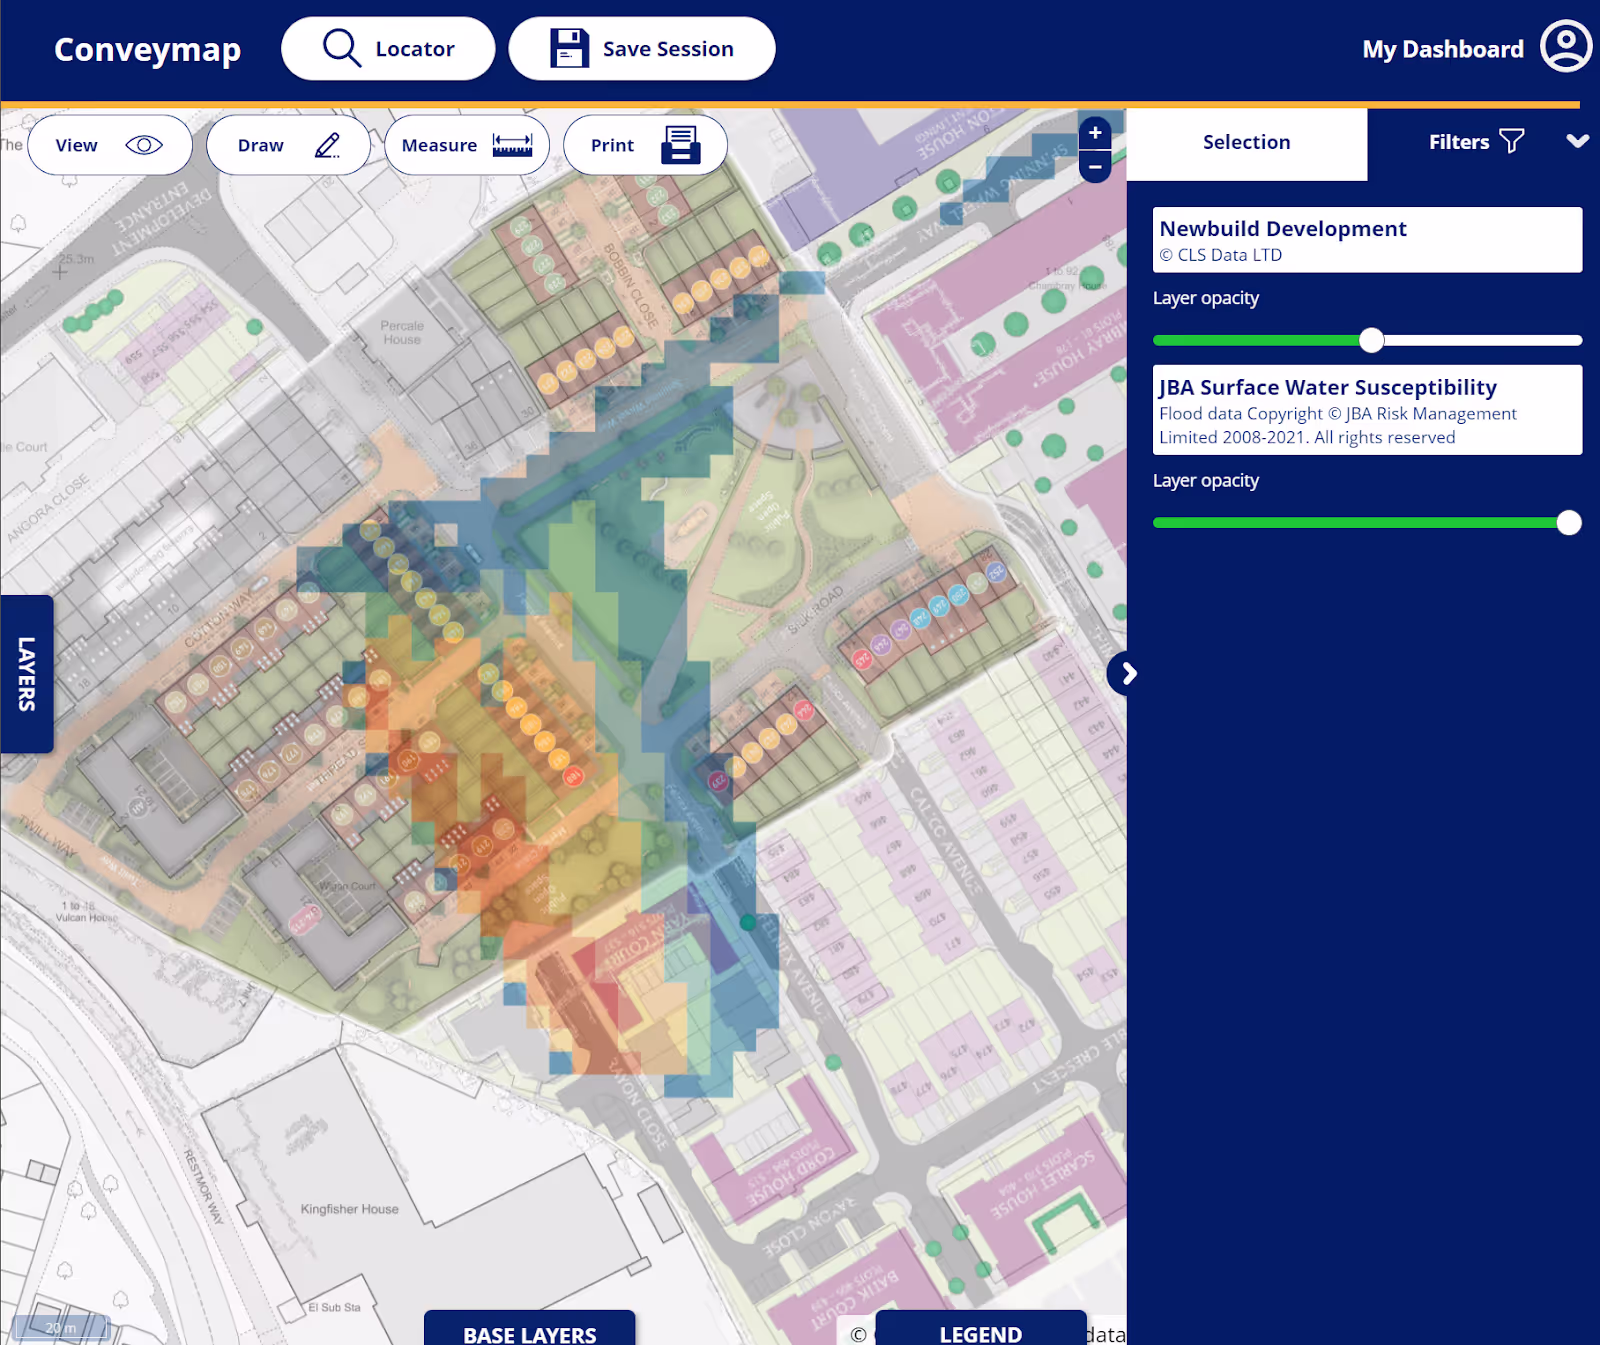
Dragging the white title bar will adjust the sequencing of the layer
Here we have moved the newbuild layer on top of the flood data and made the newbuild layer semitransparent using the opacity slider.
Measurement
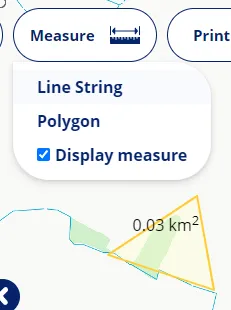
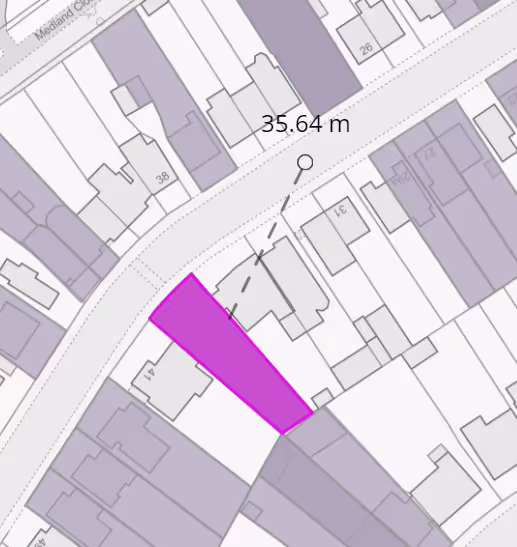
The measurement tool bar allows for free measuring of the map. This allows for measuring either the length of lines or area of shapes.
Measurements can be enabled or disabled with the Display measurements button
The length or area is shown in the most appropriate measurement unit.
For features clicked on its possible to get analytics in the left bar for the item clicked.
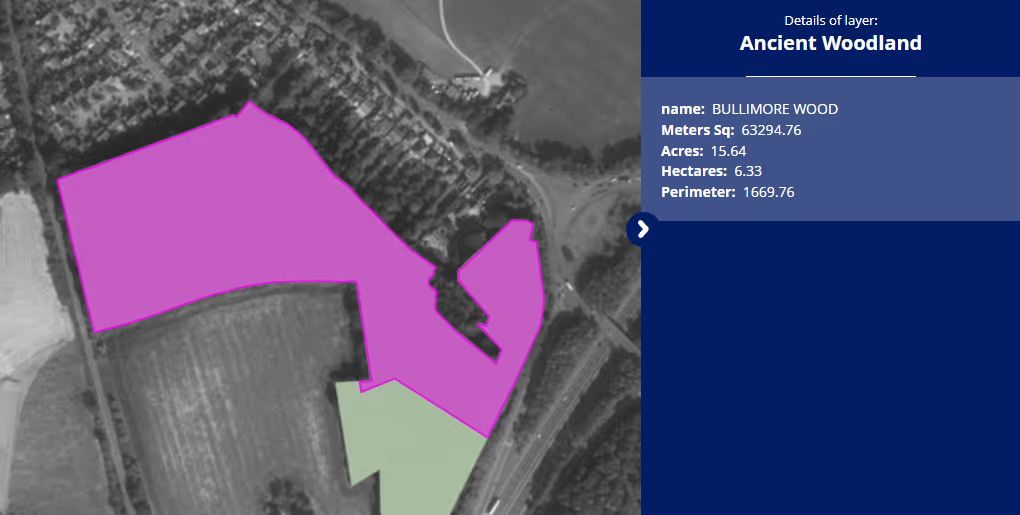
Here the area in Meters Sq, Acers, Hectares and the length of the perimeter are shown for the feature. This is done automatically for clicked features.
Printing
The print menu allows you to set up the page as required, paper size, scale and resolution are selected here. Where costs are levied against certain layers the indicative cost will display how much that print will cost. Pressing the Export PDF button will prompt you to save the session if you have not already
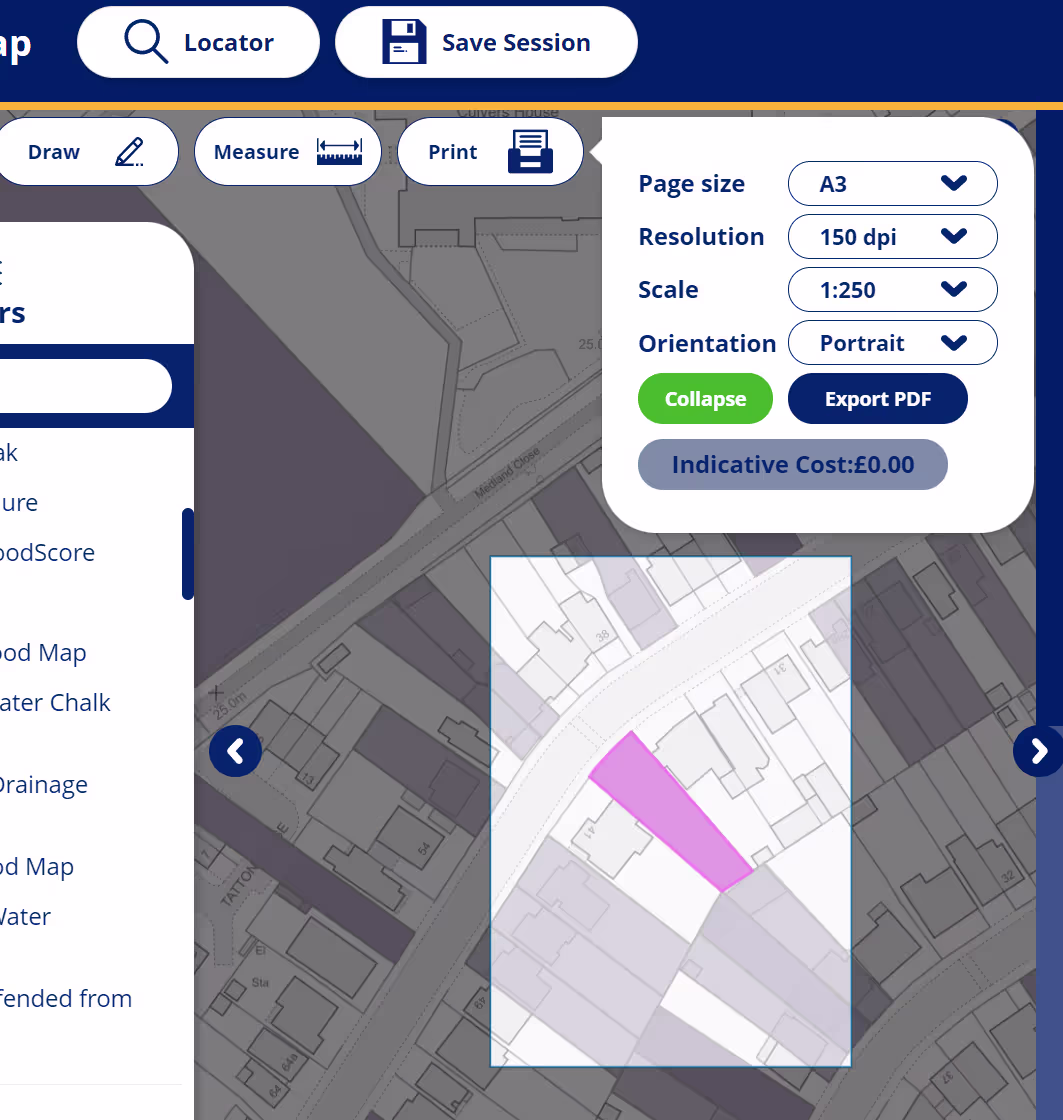
This will then generate a PDF for the area highlighted on the map, with layers configured as they are on screen. This will include transparency, and layer ordering.
Drawing
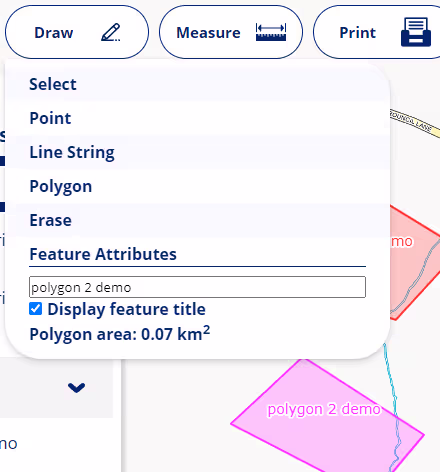
The drawing tool bar allows the user to draw into the map various different types of geometry,
- Points
- Polygons
- Lines
Each of these allow for a title to be applied to them, This title can be enabled in the drawing tool bar. Labels if enabled will be shown on the prints.
Should the user have any KML, GPX or GeoJson which is projected within EPSG:27700 they can add via the ‘Your data’ window on the left tab
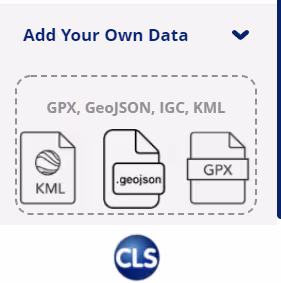
Dropping a file (Under 8MB) into this tray will display it under your drawings. It will be labeled as the file name.
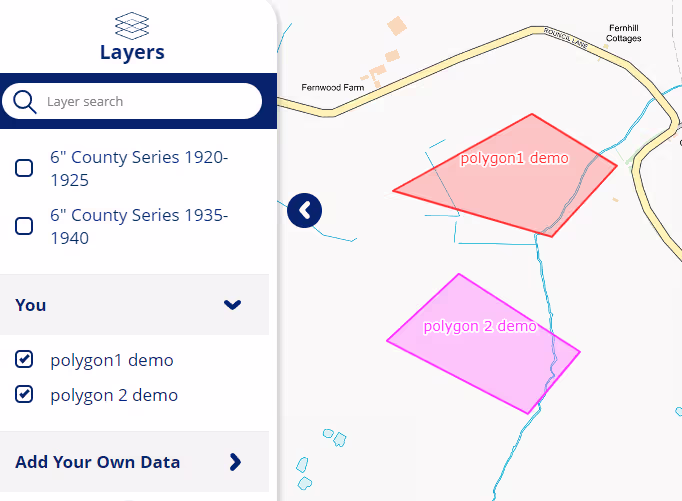
Here you can enable or disable each of the drawn geometry
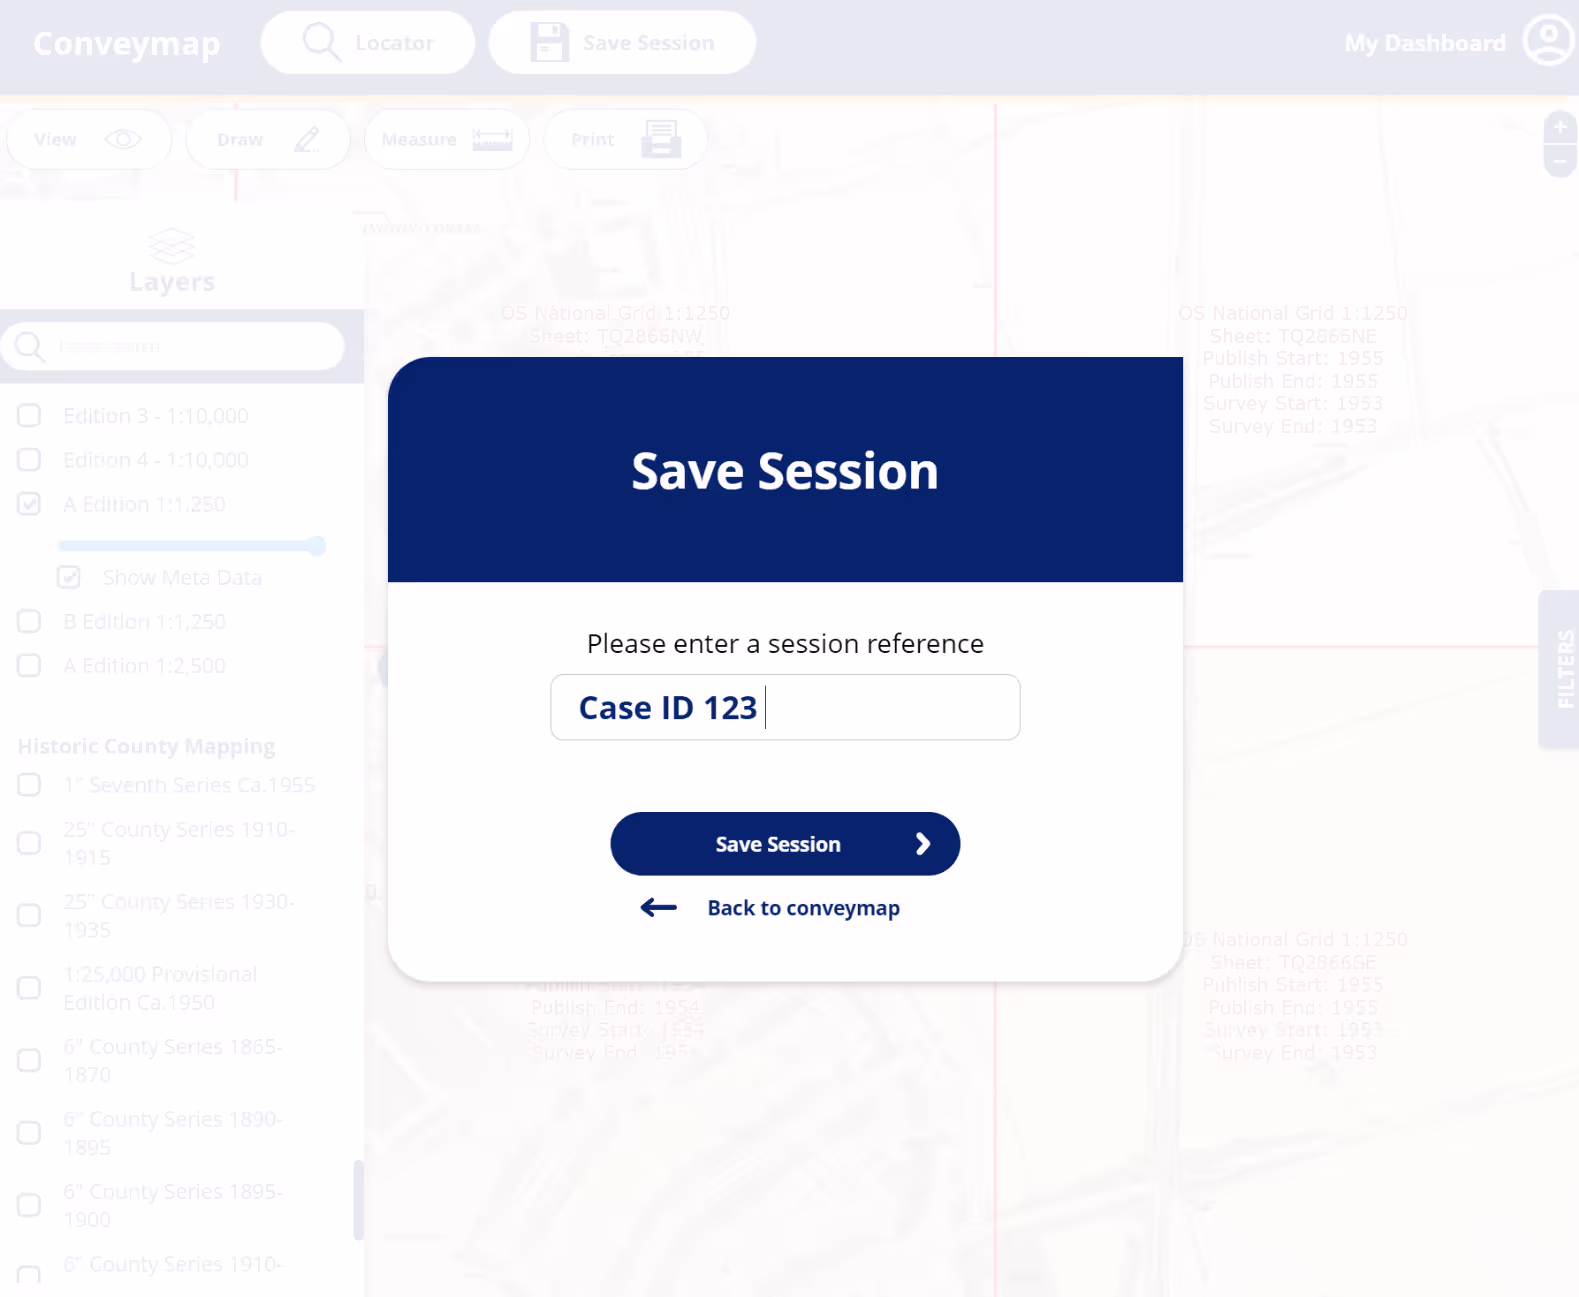
Session History
When you want to save the workspace and datasets you have created, clicking the Save Session in the top tool bar will prompt for a reference. These cases are shown in the case history app landing page.
Historic Mapping
The portal gives access to the OGC WMS services that CLS offers as a standalone product, however within portal they are wrapped into a user interface that requires no coding.
Wherever the map is located – the historical mapping layers available to the user will change. This is due to the varying coverage across the country.
They can be enabled on the left bar, and the transparency slider under each can be adjusted to compare the historical against the contemporary.
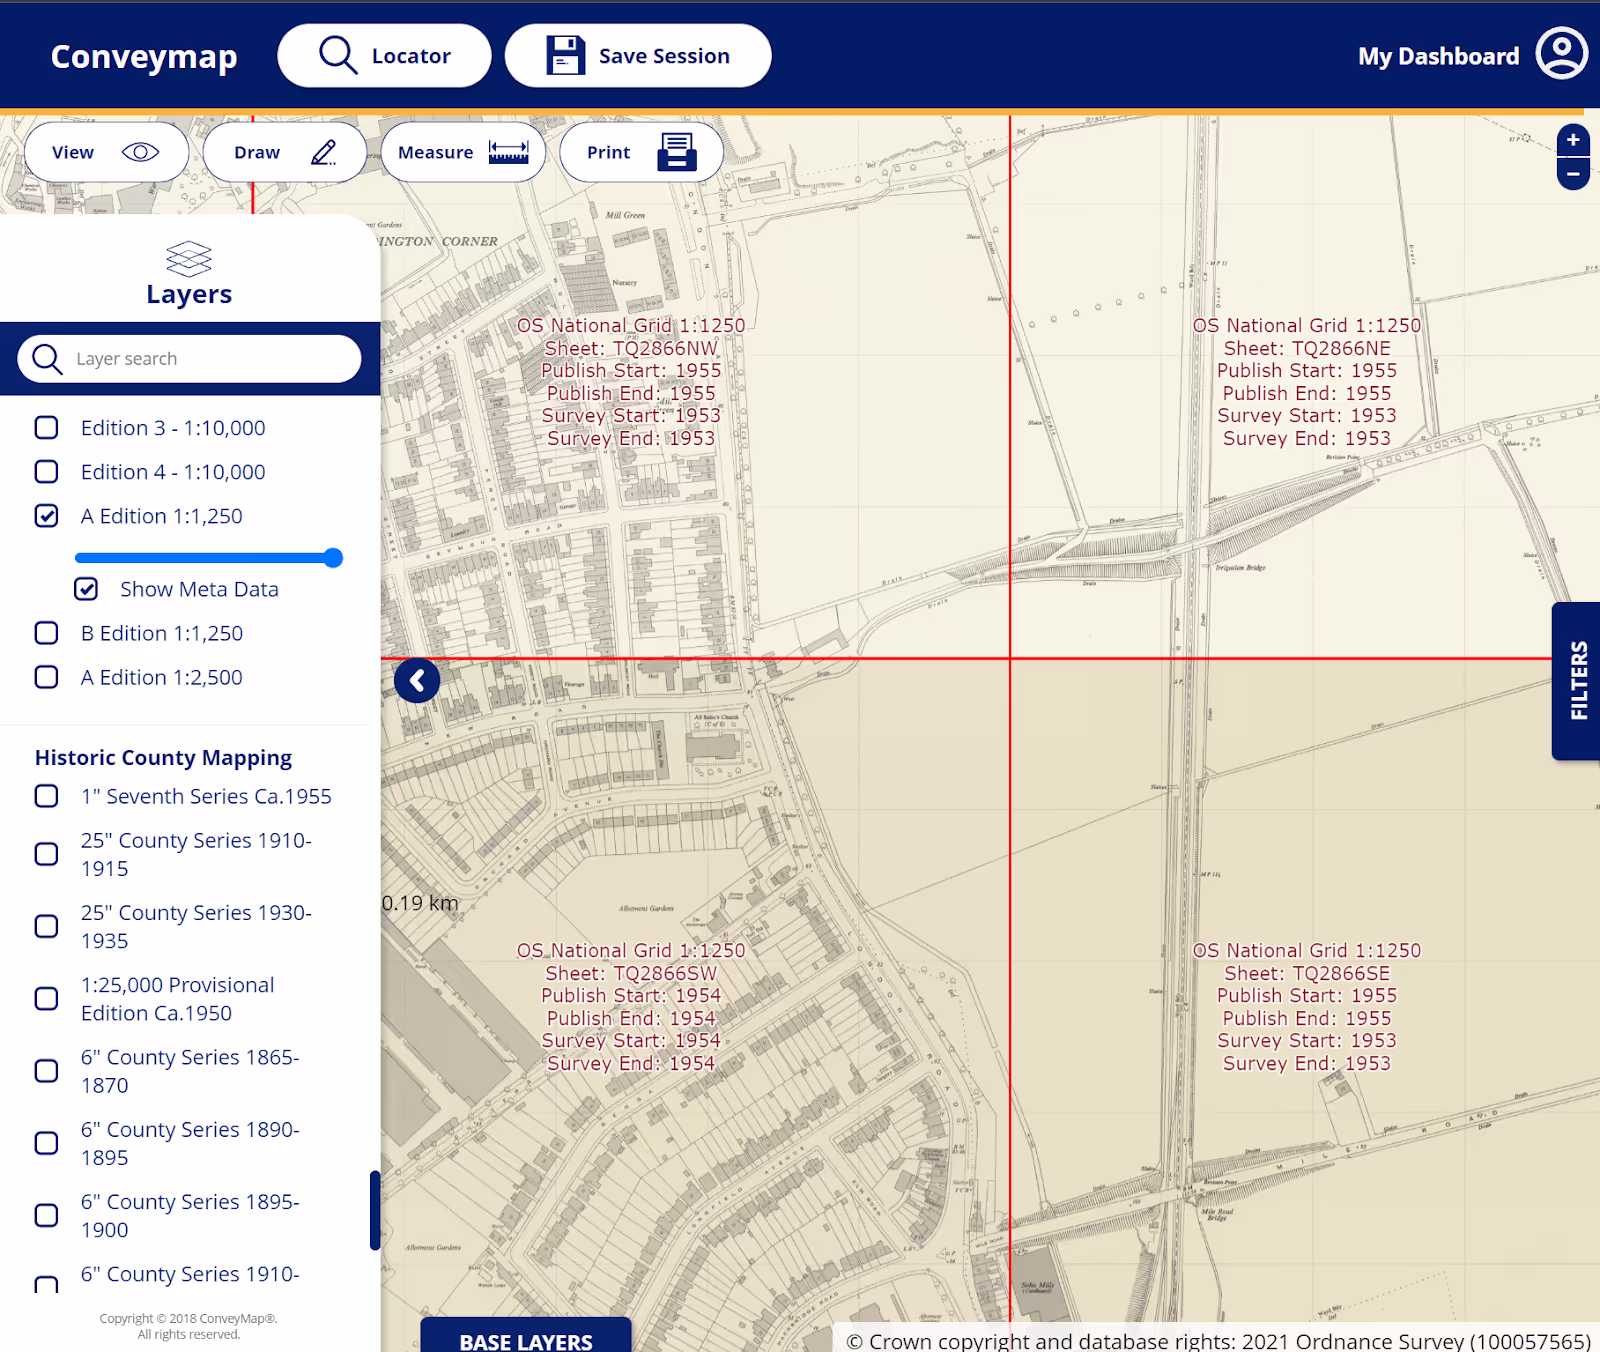
Clicking the ‘Show Metadata’ button will show the sheet ‘neat lines’ which are where the edges of the maps have been joined. The metadata relating to that map layer is shown within the sheet extents. This allows for date information to be extracted from the amalgamated map layers.
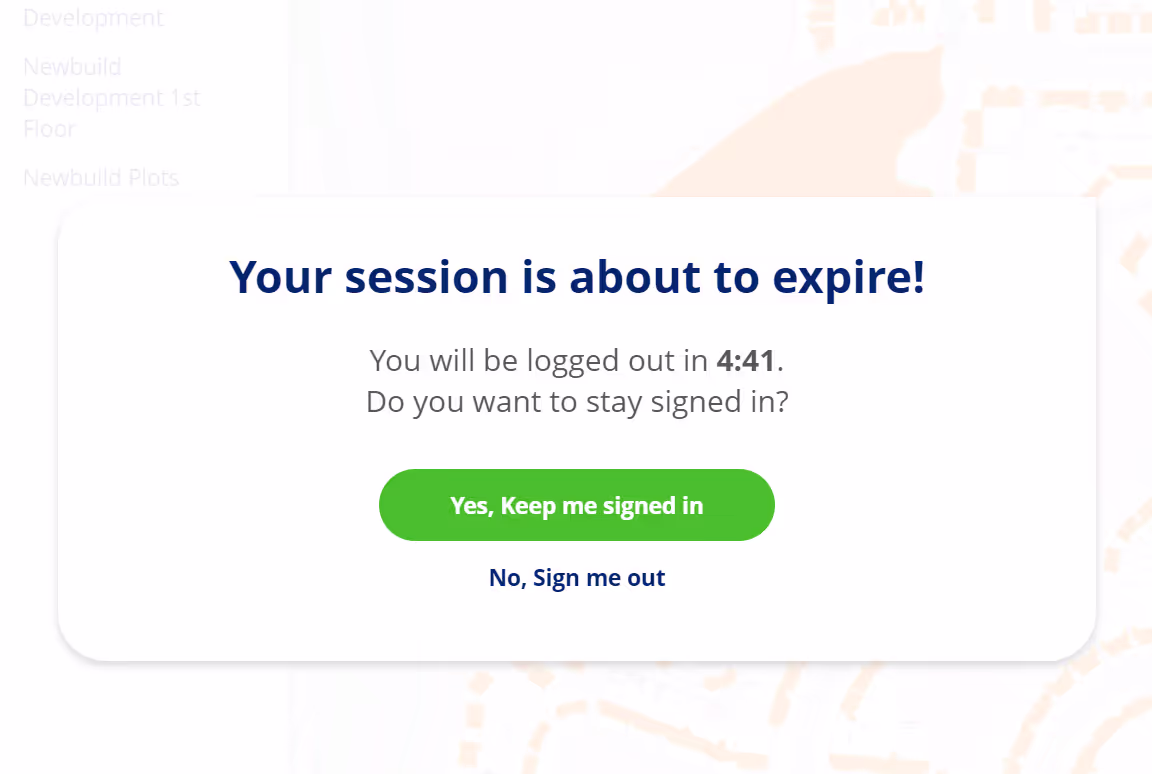
Housekeeping
To ensure that sessions are not used maliciously the system will time out. However , a warning is presented and gives a 5min count down to sign out. At this point the user can either opt to stay signed in – or log out.
It is possible to archive cases when they have reached the end of requirement. This is done via the ‘archive this case’ button on the ConveyMap app home page.
The archive process is reversable. Accessing the ‘Archived cases’ you can re-enable the case back to the applications home page.
Searching for a case will only return results for the view you are in – be it active cases or archived.
87.0
NPS Score
Trusted to deliver a ‘world class’ service. CLSPI's service rating from legal professionals in 2023


